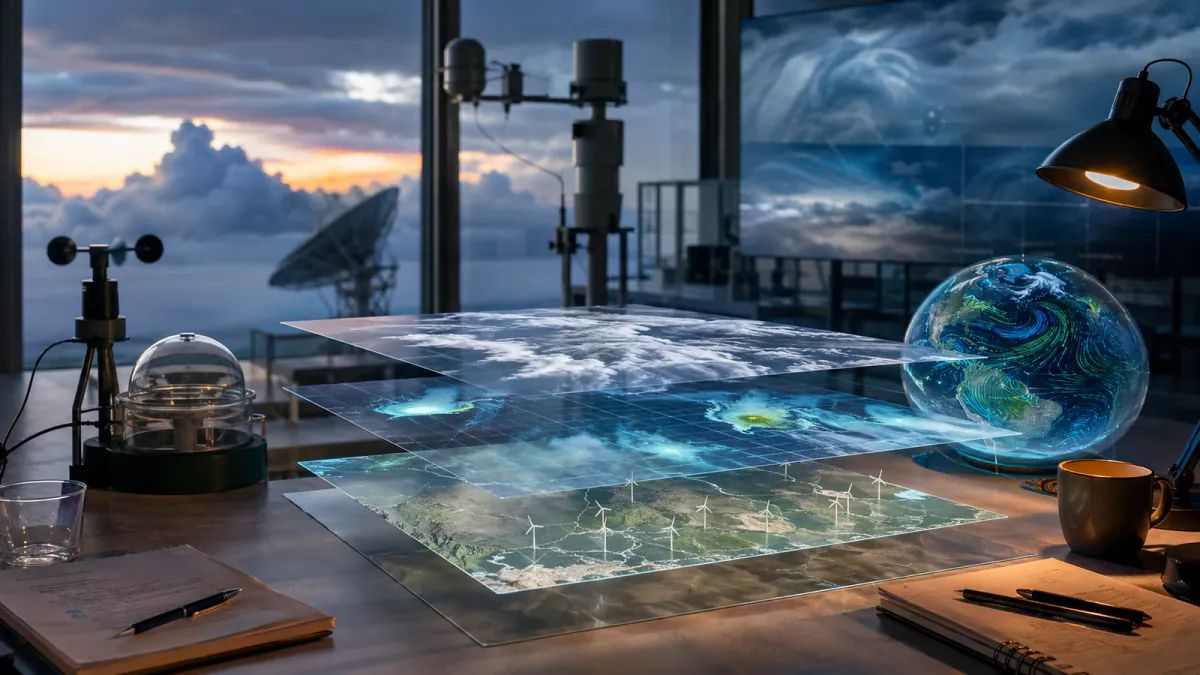
Google’s WeatherNext 3 changes the tempo of global AI weather forecasting. The system takes in current satellite observations, produces a fresh forecast every hour, and resolves selected surface variables on grids as fine as 5 kilometres. It also moves directly into Google products and cloud services, turning a research model into operational infrastructure.
The advance is best understood as a tighter observation-to-forecast loop. Weather changes continuously, while many forecasting systems work from analysis cycles that introduce delay. WeatherNext 3 uses hourly mosaics from geostationary satellites alongside historical analysis and station observations. The model can therefore begin each run from a more recent view of the atmosphere and issue another global forecast an hour later.
That faster loop does not remove uncertainty. Forecast skill still varies by variable, lead time, region, season, and event type. A higher-resolution grid can describe smaller-scale structure, but it cannot determine the weather at every street or building. WeatherNext 3 is a more responsive forecasting system, not a substitute for official warnings or local meteorological expertise.
A model built around fresh observations
According to Google’s WeatherNext 3 announcement , the system feeds hourly geostationary satellite mosaics and traditional historical analysis into a Functional Generative Network mesh transformer. It produces dense gridded fields, cyclone tracks, and station-level forecasts within one architecture.
The satellite input is the defining change. Many AI forecasting systems learn from numerical weather prediction analyses, which combine observations with physics-based models to estimate the state of the atmosphere. Those analyses are extremely valuable, but their production cycle can leave a time gap between current conditions and the data available to a machine-learning model. Direct satellite observations give WeatherNext 3 a more immediate view of cloud systems and other fast-moving atmospheric features.
WeatherNext 3 also trains against sparse weather-station observations. Those measurements help connect a global grid with conditions at specific locations, particularly where temperature and humidity respond strongly to coastlines, valleys, mountains, and other terrain. Satellite and station data play different roles. Satellites provide broad, frequently updated coverage, while stations provide direct local measurements at irregular points.
The model’s output uses several spatial scales. Google says key surface variables such as temperature and moisture can be represented at 5-kilometre resolution. Other surface variables use 10-kilometre grids, while atmospheric variables such as wind speed use 25-kilometre grids. WeatherNext 2, by comparison, produced forecasts on a 25-kilometre grid at six-hour intervals.
Resolution affects what a forecast can express. A 5-kilometre grid can preserve topographic and coastal variation that a 25-kilometre grid would smooth into a broad average. It still describes an area, not an exact address. Products using the data need to distinguish model resolution from the precision a person should expect at a particular point.
Precipitation is the hardest and most important test
Rain and snow are difficult for global models because the relevant cloud processes can develop at scales smaller than the model grid. A forecast may locate a large weather system correctly while blurring its precipitation boundaries or missing an intense local cell.
Google says WeatherNext 3 was trained with NASA’s Integrated Multi-satellite Retrievals for GPM dataset and a Google precipitation reanalysis derived from satellite radar. In Google’s reported medium-range evaluations, the model improved Continuous Ranked Probability Score by as much as 60 percent against IMERG, 30 percent against the US Multi-Radar/Multi-Sensor system, and 10 percent against rain-gauge measurements at early lead times.
Those figures describe specific first-party evaluations. They are not interchangeable measures of forecast accuracy, and they do not establish the same gain for every location or weather event. Continuous Ranked Probability Score evaluates the quality of a probabilistic forecast across its possible outcomes. Results depend on the reference dataset, baseline, lead time, region, and precipitation threshold.
Independent live evaluation is therefore important. It can show whether gains persist across seasons and weather regimes, including rare extremes that may be poorly represented in an aggregate score. It can also reveal whether a model is well calibrated, meaning that events assigned a given probability occur at roughly that frequency over time.
Hourly forecasts become a product capability
WeatherNext 3 began powering weather experiences in Google Search, the Gemini app, Google Maps, the Google Maps Platform Weather API, and Google Earth Engine on September 3. Google also provides query access through BigQuery and Earth Engine, plus bulk data through Cloud Storage.
That distribution gives the model several distinct audiences. A consumer may see a more localized forecast inside Search or Maps. A researcher can compare hourly fields across regions. A developer can build an application without operating the forecasting model. An energy company can use forecasts for 100-metre wind speed, cloud cover, and solar radiation when estimating renewable generation.
Each use has a different tolerance for error. A travel-planning suggestion can be revised when the next run arrives. A grid-balancing decision or emergency response needs stronger validation, explicit timestamps, monitored data freshness, and a safe fallback. The same forecast field can support both contexts, but it should not carry the same operational authority in each one.
Hourly updates also create a product-design obligation. An application should identify when the forecast was generated, which run it is displaying, and whether the expected observations arrived. Without those details, a nominally hourly service can present stale data while appearing current.
What the finer global grid can and cannot solve
A global 5-kilometre surface grid can widen access to detailed forecasting, particularly in regions that cannot sustain a high-resolution regional numerical model. It offers a consistent technical layer across Latin America, Africa, Asia-Pacific, and other areas where observation density and computing capacity vary sharply.
The model does not erase those differences. Local forecasters still interpret terrain, measurement gaps, hazards, and community needs. Warning agencies still combine models, observations, communications systems, and established decision protocols. A globally available dataset can strengthen that work, but availability alone does not provide local calibration or institutional capacity.
WeatherNext 3’s most consequential contribution is therefore structural. It narrows the interval between observation and forecast, increases spatial detail for important surface variables, and makes the output broadly accessible through consumer and cloud products. Those features can support more responsive decisions when the surrounding application preserves uncertainty and provenance.
The next phase is sustained operational evidence. Performance must be measured across regions, seasons, variables, lead times, and high-impact events. Products need to show freshness and uncertainty clearly. Official weather forecasts, severe-weather warnings, and public-safety advisories must continue to come from the relevant national or local meteorological authority. Within that boundary, WeatherNext 3 is a substantial step toward weather systems that update closer to the pace of the atmosphere they are trying to describe.